GR Metrics Calculator and Browser

Case A (Recommended) - multiple cell counts per row
File types (.csv or .tsv)
Input files may be either comma- or tab-separated text files (.csv or .tsv).
Necessary columns
The first line in the input file needs to contain column names that exactly match those in our example files.
Metadata columns: 1) cell_line 2) treatment 3) concentration
The columns "cell_line", "treatment", and "concentration" are always required, but you may also have other metadata columns. For example, this dataset from Heiser et al.[3] contains column for clinical subtype (HR+, Her2amp, etc.) and molecular subtypes (Luminal, Basal, etc.).
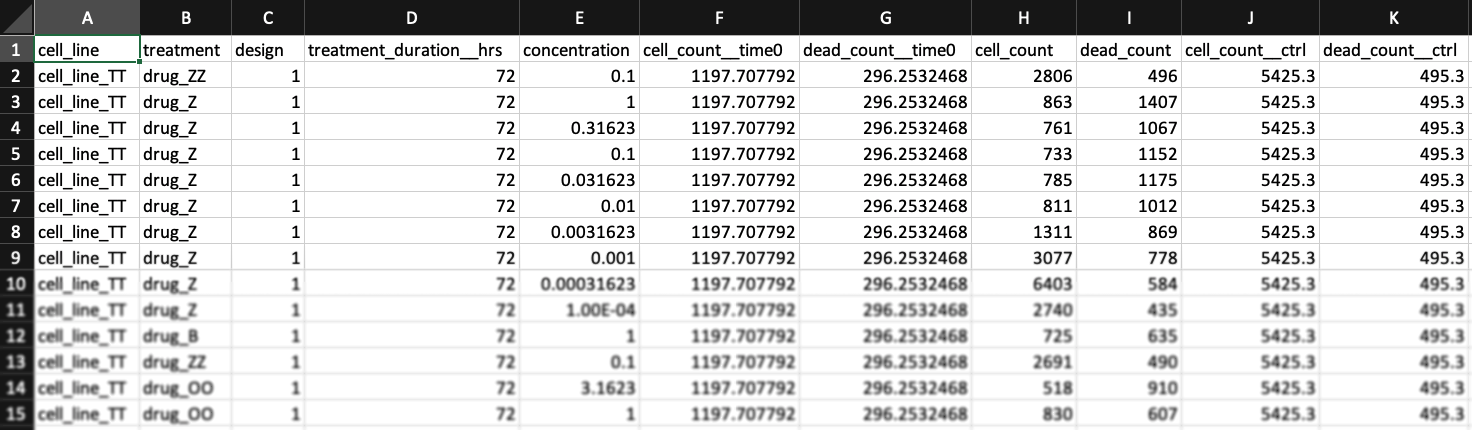
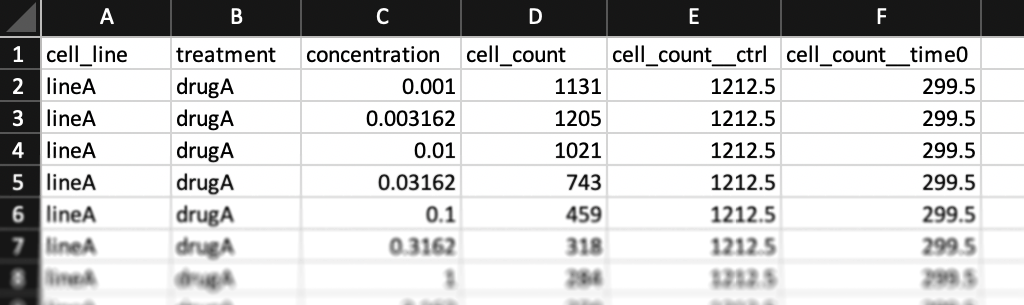
Cell count columns: 1) cell_count 2) cell_count__ctrl 3) cell_count__time0
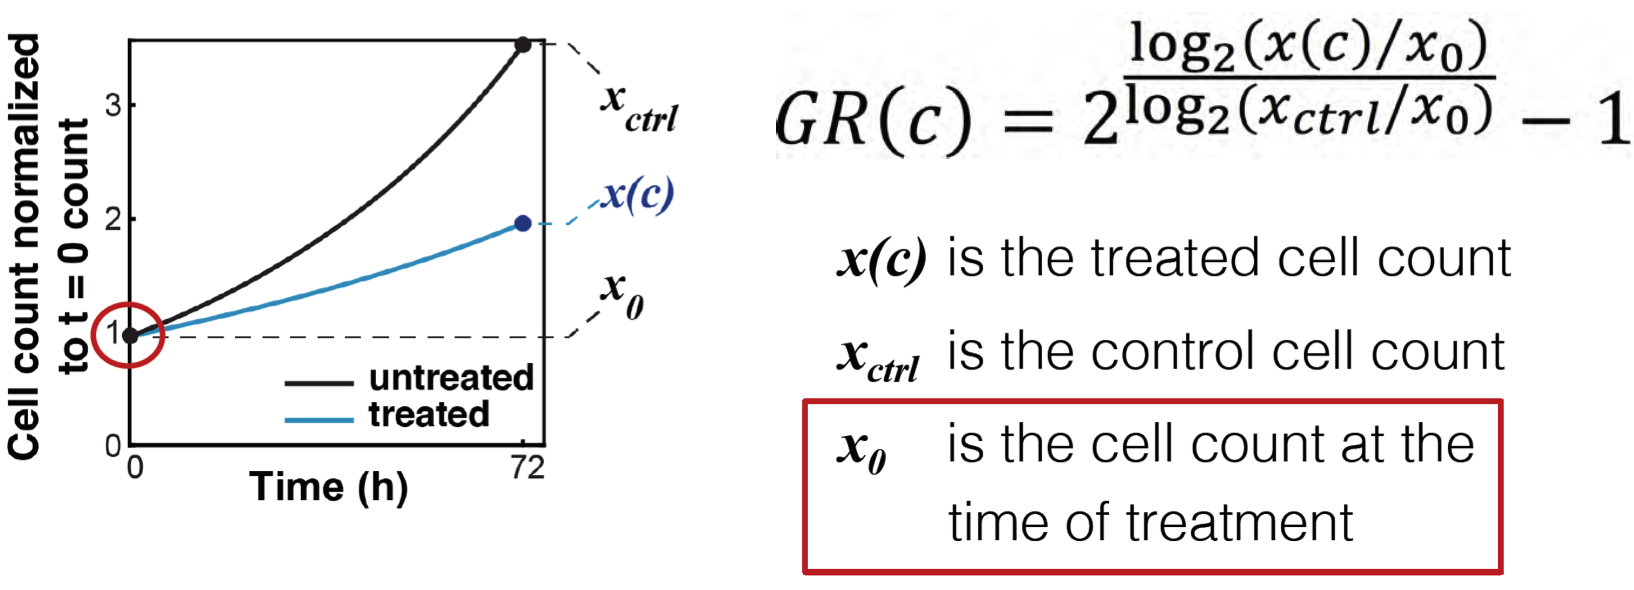
In the simplest case, the GR metrics method requires only live cell counts, or some surrogate of cell count such as cell-titer glo. We require end-of-assay counts for cells at each treated concentration ("cell_count") as well as end-of-assay counts of corresponding un-treated cells ("cell_count__ctrl") and beginning-of-assay counts ("cell_count__time0"). The control and beginning-of-assay counts may be repeated as necessary.
Note that "cell_count__ctrl" and "cell_count__time0" have one underscore between "cell" and "count", and two underscores after "count".
You may find an example dataset here.
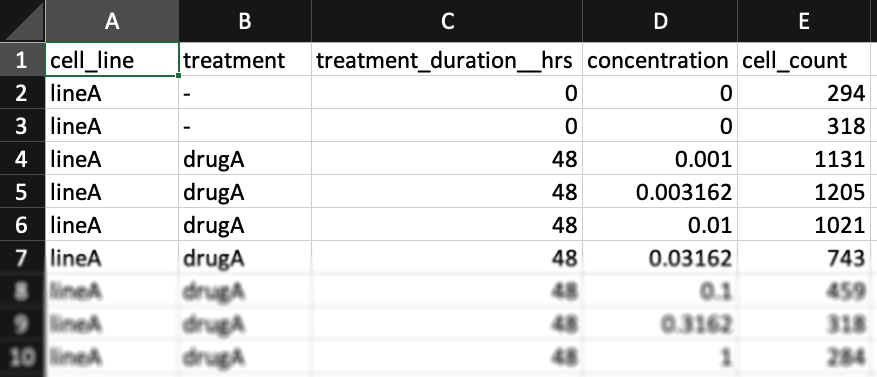
Case B (Alternative format, experimental) - one cell-count per line
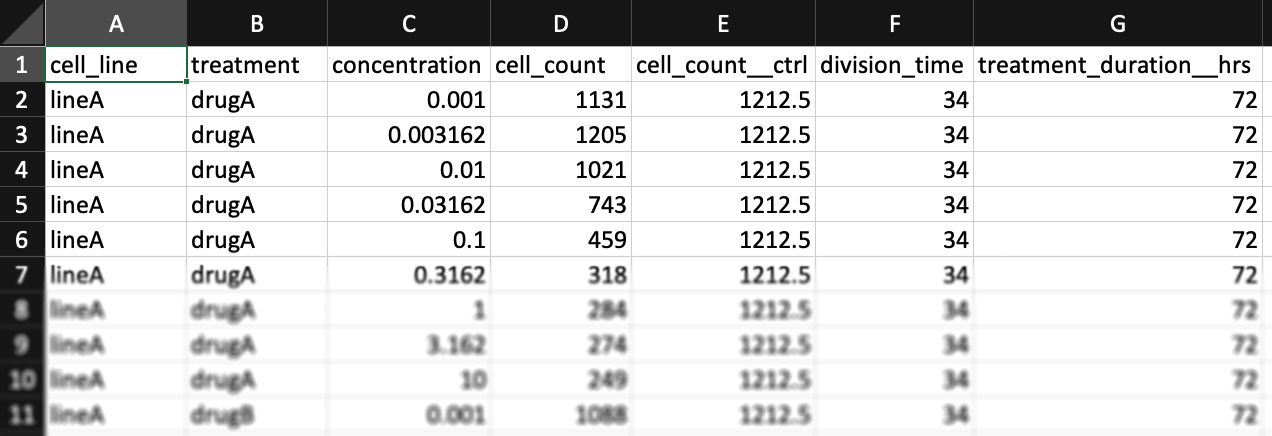
The formatting above is recommended, but if you prefer, you may format your input data with only one column per line for cell counts (Case B). In this case, only the "cell_count" column should be included (no "cell_count__ctrl" or "cell_count__time0" columns). Un-treated measurements should be indicated by a dash "-" in the "treatment" column and a "0" in the "concentration" column. A "treatment_duration__hrs" column must be included (two underscores after "duration"), with "0" indicating measurements at the beginning of the assay and a number of hours (e.g. "72" for a 3-day assay) for measurements at the end of the assay.
You may find example datasets with this formatting for the case where one has initial cell counts or where one instead has estimates of cell division time.
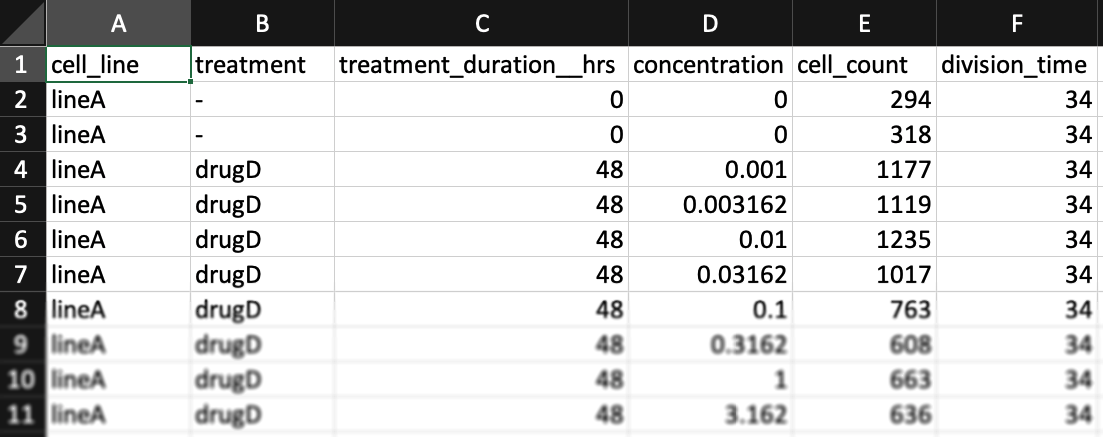
Using un-treated cell division time instead of initial cell count
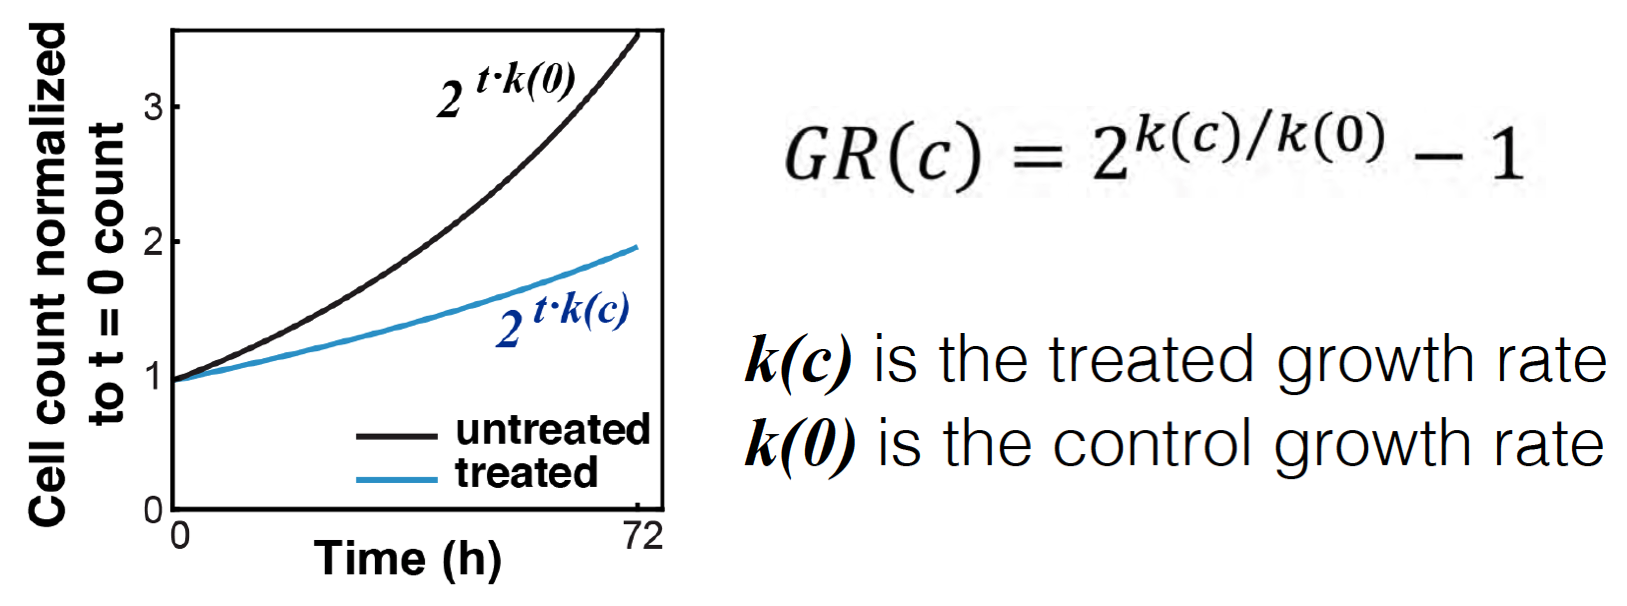
The purpose of measuring cell count at the beginning of the assay is to allow for estimation of growth-rates of treated and un-treated cells. In place of this measurement you may separately measure the growth-rate of each (un-treated) cell line.
In this case, you may swap the "cell_count__time0" column with two columns: "treatment_duration__hrs" – the length of the assay (in hours), and "division_time" - the number of hours it takes cells from each (untreated) cell line to double in population.
Note that "cell_count__ctrl" and "cell_count__time0" have one underscore between "cell" and "count", and two underscores after "count".
You may find an example dataset here.